

Image Details
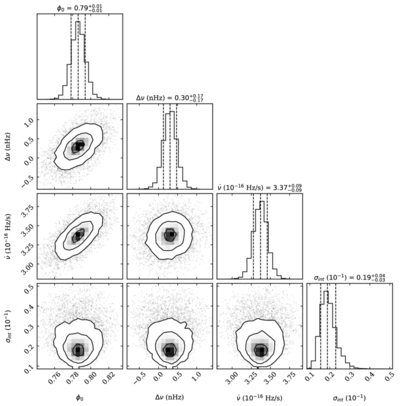
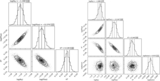
Caption: Figure B2.
Corner plots of the posterior distributions of the timing model parameters obtained from the Bayesian analysis. The contours correspond to 1σ, 2σ, and 3σ credible regions.
Other Images in This Article
Copyright and Terms & Conditions
© 2026. The Author(s). Published by the American Astronomical Society.

Copyright ©
2026 Astronomy Image Explorer. All Rights Reserved.
