

Image Details
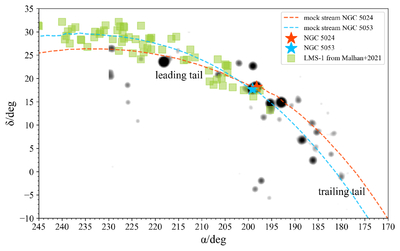
Caption: Figure 2.
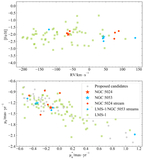
Weighted sky map of our sample, smoothed with a Gaussian filter (σ = 5). The image is scaled between 0.7 and 5 (using vmin and vmax parameters of matplotlib.imshow) to enhance the visibility of the leading and trailing tails. The position of NGC 5024 and the median location of its simulated tidal stream are marked in red, while NGC 5053 and its stream median are shown in blue. The stellar stream LMS-1 is also plotted, adopted from K. Malhan et al. (2021).
Other Images in This Article
Copyright and Terms & Conditions
© 2026. The Author(s). Published by the American Astronomical Society.

Copyright ©
2026 Astronomy Image Explorer. All Rights Reserved.
