

Image Details
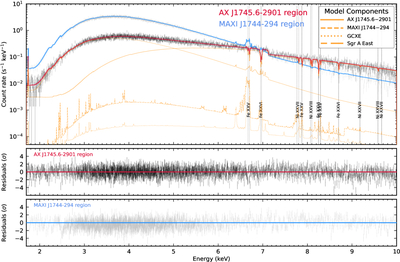
Caption: Figure 2.
Phase-averaged XRISM/Resolve spectra of the AX J1745.6−2901 extraction region and the MAXI J1744−294 extraction region, fitted simultaneously to account for contamination in the Resolve field of view. The AX J1745.6−2901 data and best-fit total model are shown in black and red, respectively, while the MAXI J1744−294 data and best-fit total model are shown in silver and blue, respectively. The best-fit model includes two-velocity absorption components in AX J1745.6−2901. Orange curves show the model contributions to the AX J1745.6−2901 region spectrum from AX J1745.6−2901 (solid), MAXI J1744−294 (dashed), Sgr A East (long-dashed), and the Galactic center X-ray emission (GCXE; dotted). The labeled vertical markers indicate the main absorption features included in the AX J1745.6−2901 model. The lower panels show the residuals in units of (data−model)/error.
Other Images in This Article
Copyright and Terms & Conditions
© 2026. The Author(s). Published by the American Astronomical Society.

