

Image Details
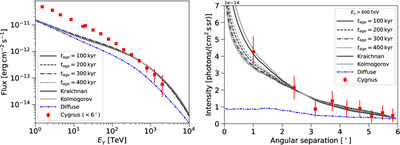
Caption: Figure 1.
Left panel: the γ-ray flux from within a 6° radius emission region for Iroshnikov–Kraichnan (δ = 1/2; black lines) and Kolmogorov (δ = 1/3; gray lines) turbulence phenomenology, when tage = 100 (solid lines), 200 (dashed lines), 300 (dotdashed lines), and 400 (dotted lines) kyr, which is the elapsed time since the injection starts. The blue dashed–dotted–dotted line shows the diffuse Galactic γ-ray flux, which is produced by the CR “sea” as measured locally on the Earth, while the black and gray lines show the summation of our model and diffuse γ-ray fluxes. The red flux points for a 6° radius bubble are taken from LHAASO Collaboration (2024). The diffusion coefficient normalization D0 = 3 × 1029 cm2 s−1 for both Iroshnikov–Kraichnan and Kolmogorov turbulence, the CR injection spectral index s = 2.0 and its cutoff energy E0 = 10 PeV, the gas distribution is homogeneous and its density nH = 1 cm−3, while the CR injection kinetic powers are given in Table 1. Right panel: the integrated γ-ray intensity above 400 TeV. The line styles and corresponding parameters are the same as the left panel.
Other Images in This Article
Copyright and Terms & Conditions
© 2026. The Author(s). Published by the American Astronomical Society.

