

Image Details
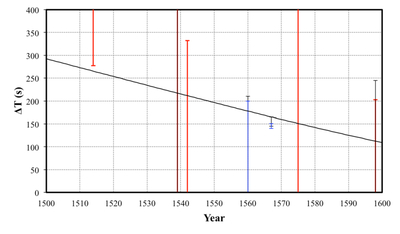
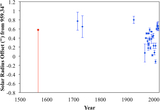
Caption: Figure 3.
ΔT constraints derived from Clavius’s eclipse reports in this study (blue bars) and those in the previous studies (black bars for M+21 and red bars for H+26b), in comparison with M+21’s ΔT spline curve (black line).
Other Images in This Article
Copyright and Terms & Conditions
© 2026. The Author(s). Published by the American Astronomical Society.

Copyright ©
2026 Astronomy Image Explorer. All Rights Reserved.
