

Image Details
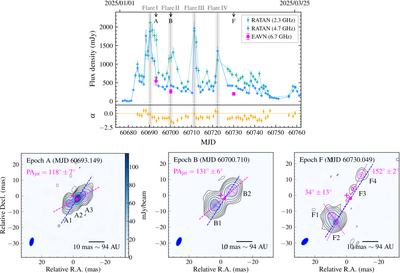
Caption: Figure 1.
Top: radio light curves of GRS 1915+105 from 2025 January to March, observed with RATAN at 2.3 and 4.7 GHz (top), together with the corresponding spectral index (bottom), defined as ﹩\alpha =\mathrm{log}({S}_{2}/{S}_{1})/\mathrm{log}({\nu }_{2}/{\nu }_{1})﹩. No data are available between MJD 60723 and 60726. Four radio flares are identified, peaking at MJD 60690.4 ± 1 (Flare I), 60700.0 ± 1 (Flare II), 60711.3 ± 1 (Flare III), and 60722.4 ± 1 (Flare IV). Our EAVN epochs (A, B, and F) are also marked at the top of the x-axis, with the corresponding VLBI total flux densities overlaid. Bottom: EAVN 6.7 GHz phase-referenced images of GRS 1915+105 obtained in 2025. All images share the same color bar, as indicated in the epoch A image. The FWHM of the synthesized beam is shown in the lower-left corner of each panel. Contours are drawn starting at ±3Irms (see Table 1) and increase by successive factors of 2. Dashed contours represent negative levels. The magenta circles show the position and FWHM of the model-fitted circular Gaussian components. The magenta dashed line indicates the jet orientation (i.e., PA) derived from the component relative distances (see Section 3.1), while the blue dashed line represents the typical orientation for the southeast–northwest jet, with 〈PA〉 = 147∘ ± 8∘ (L. F. Rodríguez & I. F. Mirabel 2025). The magenta cross marks the extrapolated position of GRS 1915+105 on 2025 January 1 (﹩1{9}^{{\rm{h}}}1{5}^{{\rm{m}}}11\mathop{.}\limits^{s}5437\pm 1.0﹩ mas, ﹩+1{0}^{\circ }5{6}^{{\prime} }44﹩ ﹩\mathop{.}\limits{^{\prime\prime} }﹩594 ± 1.3 mas), as derived from the source coordinates on 2000 January 1 and its proper motion (see Section 3.1). The magenta dots correspond to the image intensity peak of epoch A at ∼( −2.4, −2.0) mas, which is where the core is located.
Other Images in This Article
Copyright and Terms & Conditions
© 2026. The Author(s). Published by the American Astronomical Society.

