

Image Details
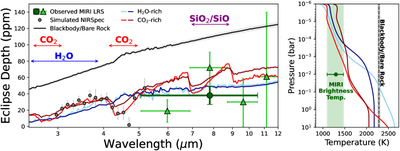
Caption: Figure 4.
Left: models of potential emission spectra of HD 3167 b’s atmosphere computed by GENESIS (A. A. Piette et al. 2023), shown alongside our global-fit MIRI LRS white-light (5.06–10.55 μm, excluding the shadowed region) eclipse depth (dark green circle) and SPARTA low-resolution eclipse spectrum (green triangles). Models are binned to a resolving power of R = 100 for visual clarity. These models assume a volatile component of 67% O2 + 33% CO2 (red) and 100% H2O (blue), with dark and light colors indicating high (30%) and low (1%) rock-vapor fractions, respectively. Shading represents the uncertainty in the planet-to-star radius ratio. Gray points represent simulated NIRSpec G395H data at R = 15 assuming five total eclipses, showing how future emission observations may be able to distinguish between different volatile-rich scenarios. Right: temperature–pressure profiles for each atmospheric model, including the maximum theoretical temperature (black) and measured MIRI LRS brightness temperature (green).
Other Images in This Article
Copyright and Terms & Conditions
© 2026. The Author(s). Published by the American Astronomical Society.

