Image Details
Caption: Figure 3.
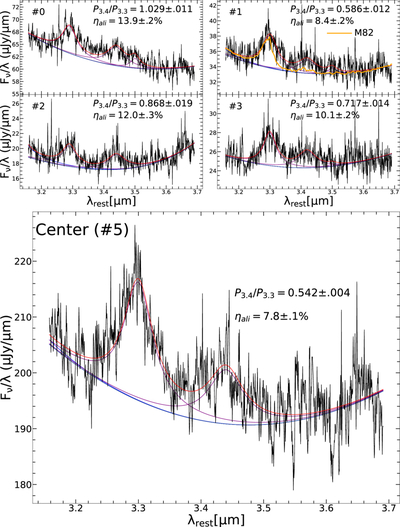
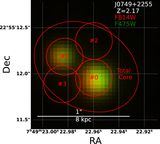
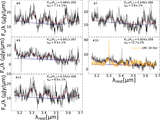
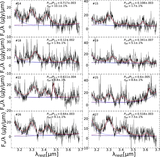
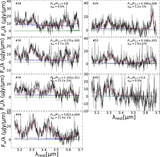
JWST/MIRI rest-frame spectra extracted for the brightest inner regions of J0749+2255: two small apertures of 1.7 kpc each for the quasar cores (#0, #1) and two apertures offset from the cores (#2, #3), as well as the entire inner region (#5) represented by a large 3.7 kpc × 5.0 kpc ellipse (see Figures 1 and 2(b)). Utilizing the PAHFIT tool, the observed spectra are decomposed into two Drude profiles (magenta lines) and an underlying continuum (blue line), with the two Drude profiles characterizing the 3.3 μm aromatic and 3.4 μm aliphatic features, and the red line as the sum of the two Drude profiles and the continuum. For Regions #0 and #1, a secondary subfeature at ∼3.49–3.51 μm is also shown. For comparison, we also overlay the JWST/NIRSpec spectrum of the starburst galaxy M82 (orange line; E. Sturm et al. 2000) to that of #1, after normalizing to the 3.3 μm peak of #1. Clearly, the PAH molecules in J0749+2255 are more aliphatic than those in M82. In each panel, the ratio of the power emitted in the 3.4 μm feature to that in the 3.3 μm feature (P3.4/P3.3) is labeled. Also labeled is ηali, the aliphatic fraction of PAHs (see Section 4).
Other Images in This Article
Copyright and Terms & Conditions
© 2026. The Author(s). Published by the American Astronomical Society.