Image Details
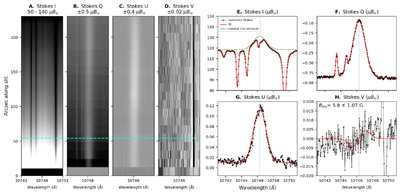
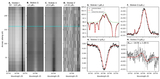
Caption: Figure 4.
Panels (A)–(D) show the Stokes I, Q, U, and V spectra, respectively, along a single slit position for the 2025 August 8 cavity, based on the purple line through the cavity at 15″ in scanning direction, as shown in Figure 3(A). The cyan lines represent a single location on the slit (at 55″ along the slit), as shown in Panels (E)–(H), which include the corrected observed (black) and fitted (red) Stokes I, Q, U, and V profiles, respectively. Panel (E) includes the Gaussian profile for the coronal line emission (green). We indicate the line center as the vertical gray dashed lines.
Other Images in This Article
Copyright and Terms & Conditions
© 2026. The Author(s). Published by the American Astronomical Society.
Copyright ©
2026 Astronomy Image Explorer. All Rights Reserved.