Image Details
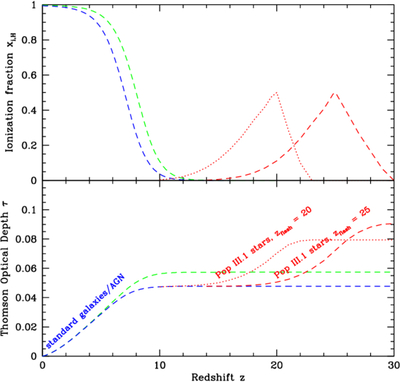
Caption: Figure 1.
(a) Top: ionization fraction history of the Universe, shown as a function of redshift, with xi,H measuring the fraction of H atoms that are ionized. The green dashed line shows a standard reionization history described with a ﹩{\rm{\tanh }}(z)﹩ function with ﹩{z}_{{\rm{re}}}=8﹩ (Equation (1)), from fully ionized conditions at low redshift to fully neutral conditions at high redshift. The dashed blue line is an equivalent model, but with ﹩{z}_{{\rm{re}}}=7﹩. Note, these models include a standard treatment of He reionization (see text). The red lines show fiducial ionization histories resulting from Pop III.1 supermassive stars, peaking at zflash = 20 (dotted) and 25 (dashed). (b) Bottom: Thomson optical depth to electron scattering, τ, integrated out to redshift, z. The green and blue dashed lines show the ﹩{\rm{\tanh }}(z)﹩ models with ﹩{z}_{{\rm{re}}}=8﹩ and 7, respectively, representing the contribution from “standard” galaxies and AGN. The red dotted and dashed lines show the contribution from Pop III.1 supermassive stars with epoch of peak flash ionization at zflash = 20 and 25, respectively, which have been combined with the ﹩{\rm{\tanh }}(z)﹩ with ﹩{z}_{{\rm{re}}}=7﹩ model.
Other Images in This Article
Copyright and Terms & Conditions
© 2026. The Author(s). Published by the American Astronomical Society.