Image Details
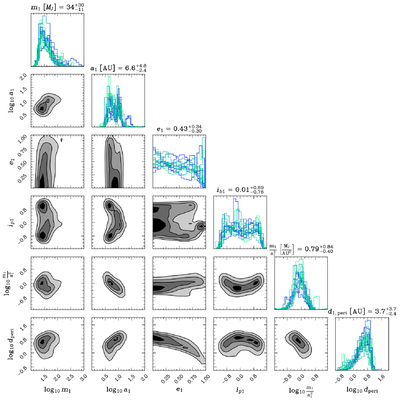
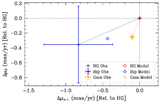
Caption: Figure 5.
Posterior distributions of the companion’s mass, semimajor axis, eccentricity, mutual inclination relative to the transiting planet, astrometric acceleration measure, and pericenter distance, as inferred from the joint astrometric and TTV analysis. Filled contours indicate 0.5σ, 1σ, 1.5σ, and 2σ confidence levels. Colored histograms correspond to independent sampling runs. Values quoted above each diagonal panel give the posterior median and central 68% credible interval, defined by the 16th and 84th percentiles of the combined posterior.
Other Images in This Article
Copyright and Terms & Conditions
© 2026. The Author(s). Published by the American Astronomical Society.
Copyright ©
2026 Astronomy Image Explorer. All Rights Reserved.