Image Details
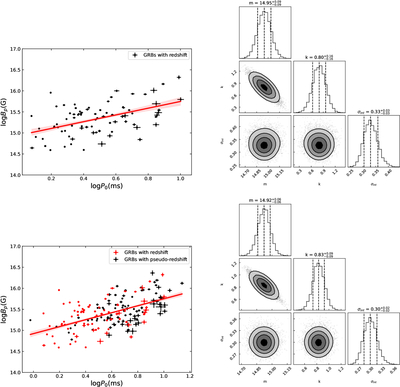
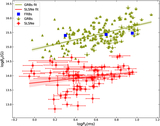
Caption: Figure 4.
The Bp–P0 correlation for the GRB sample (assuming ηx = 0.5). The best-fit curve is represented by the red solid line, with its corresponding 1σ confidence interval indicated by the shaded region. Top: Bp–P0 correlation (left) and its corner plot (right) for GRBs with redshifts. Bottom: Bp–P0 correlation (left) and its corner plot (right) for all GRBs.
Other Images in This Article
Copyright and Terms & Conditions
© 2026. The Author(s). Published by the American Astronomical Society.
Copyright ©
2026 Astronomy Image Explorer. All Rights Reserved.