Image Details
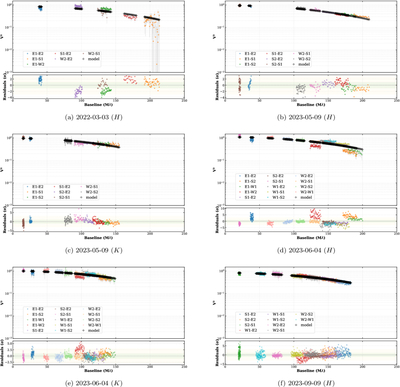
Caption: Figure A1.
Model fits and residuals for T CrB (part 1 of 2). The upper panel of each subplot shows the squared visibility V2 vs. the baseline length, with data points colored by baseline pair and the best-fit limb-darkened disk model (scaled by ﹩{V}_{0}^{2}﹩) shown as black dots. The lower panel shows residuals in units of σ; green shading indicates the ±1σ region and yellow shading the ±3σ region.
Other Images in This Article
Copyright and Terms & Conditions
© 2026. The Author(s). Published by the American Astronomical Society.
Copyright ©
2026 Astronomy Image Explorer. All Rights Reserved.