Image Details
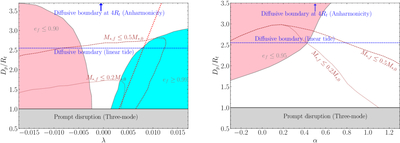
Caption: Figure 4.
Left: parameter-space plot showing the evolution of the MS-MBH binary (α = 0.8) for different initial Dp/Rt and λ. The brown contours indicate the regions in which the final stellar mass (M*,f) reaches 50% and 20% of the initial mass (M*,0). The pink and cyan regions correspond to orbital circularization and binary unbinding, respectively. The red dotted line marks the approximate boundary separating regimes in which the star or the orbit is disrupted first (Equation (8)). The prompt-disruption region is shaded in gray. Right: parameter-space plot of the evolution for different initial Dp/Rt and α, with λ = 0. The pink region now corresponds to ef < 0.95 rather than 0.90. Further, no region with ef > 0.99 is present.
Other Images in This Article
Copyright and Terms & Conditions
© 2026. The Author(s). Published by the American Astronomical Society.