Image Details
Caption: Figure 4.
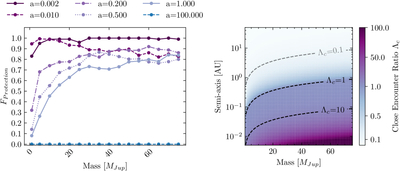
Simulation results for dynamical shielding scenario. Left panel: protection rates (Fprotection) as a function of mass, with different line styles representing distinct semimajor axis values. Right panel: mapping the modified close encounter ratio in the planetary mass–semimajor axis diagram.
Other Images in This Article
Copyright and Terms & Conditions
© 2026. The Author(s). Published by the American Astronomical Society.
Copyright ©
2026 Astronomy Image Explorer. All Rights Reserved.