Image Details
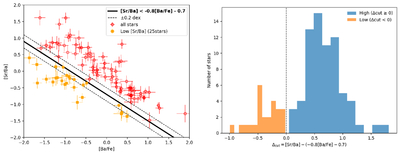
Caption: Figure 1.
Left: distribution of the sample star in the [Ba/Fe]–[Sr/Ba] plane. The solid black line shows the selection boundary, [Sr/Ba] = −0.8[Ba/Fe] − 0.7, and the dashed lines indicate the ±0.2 dex uncertainty band. Right: histogram of the signed offset from the selection boundary, Δcut = [Sr/Ba] + 0.8[Ba/Fe] + 0.7. The dashed line marks the adopted division at Δcut = 0, separating the low-[Sr/Ba] stars from the rest of the sample.
Other Images in This Article
Copyright and Terms & Conditions
© 2026. The Author(s). Published by the American Astronomical Society.
Copyright ©
2026 Astronomy Image Explorer. All Rights Reserved.