Image Details
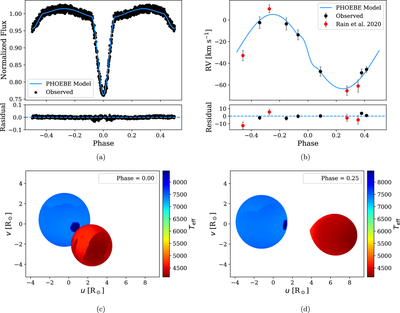
Caption: Figure 2.
(a) The fitted LC with the PHOEBE model, with points representing the phase-folded data. (b) The fitted RV curve of the primary component with the PHOEBE model. (c) A mesh representation of the temperature distribution across the stellar photospheres, including a spot at phase 0.00, where the blue star is the BSS with a hotspot and the red star is the donor, respectively. (d) A mesh representation of the temperature distribution across the stellar photospheres, including a spot at phase 0.25, where the blue star is the BSS with a hotspot and the red star is the donor, respectively.
Other Images in This Article
Copyright and Terms & Conditions
© 2026. The Author(s). Published by the American Astronomical Society.
Copyright ©
2026 Astronomy Image Explorer. All Rights Reserved.