Image Details
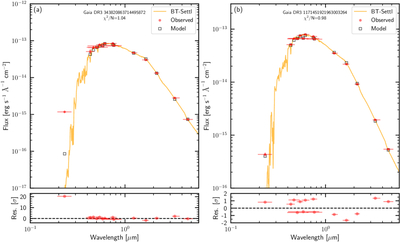
Caption: Figure 2.
(a) SED example for a candidate with UV excess. (b) SED example for a candidate without UV excess. The optical-to-infrared SEDs of both sources can be well fitted by a single-star SED model. For each panel, red points show observed fluxes, open black squares show model-predicted fluxes, and the orange curve shows the best-fit spectrum.
Other Images in This Article
Copyright and Terms & Conditions
© 2026. The Author(s). Published by the American Astronomical Society.
Copyright ©
2026 Astronomy Image Explorer. All Rights Reserved.