Image Details
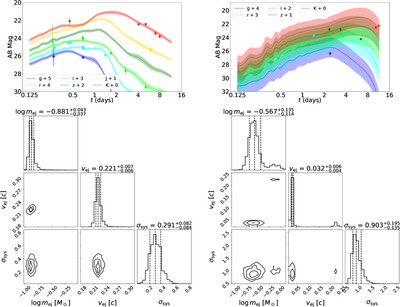
Caption: Figure 3.
GRB 211211A (left) and GRB 230307A (right) optical/near-infrared observations compared to the best-fit interpolated light curve characterized by the parameter values reported in the posterior plots under the assumption of a weak r-process ejecta composition. The r and i observations at 0.27 days are artificially separated by ±0.01 days for visual clarity.
Other Images in This Article
Copyright and Terms & Conditions
© 2026. The Author(s). Published by the American Astronomical Society.
Copyright ©
2026 Astronomy Image Explorer. All Rights Reserved.