Image Details
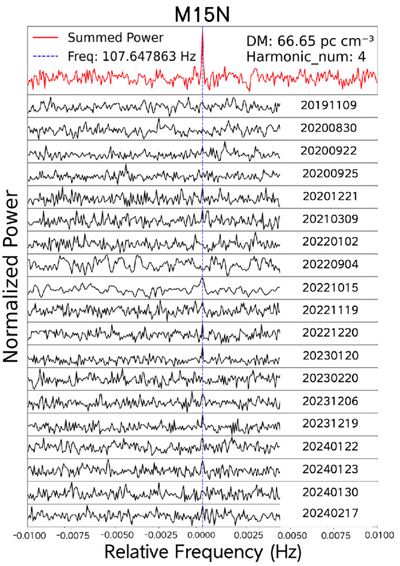
Caption: Figure 2.
Power spectra of M15N from 19 observations (panels with black solid lines, with observing dates) and the stacked spectrum (top panel with red solid line). Every spectrum is with harmonic summing up to the fourth harmonic. The vertical dashed line marks the pulsar’s spin frequency.
Other Images in This Article
Copyright and Terms & Conditions
© 2026. The Author(s). Published by the American Astronomical Society.
Copyright ©
2026 Astronomy Image Explorer. All Rights Reserved.