Image Details
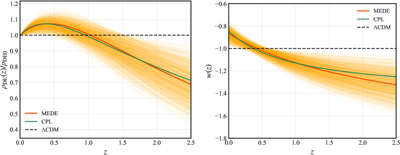
Caption: Figure 3.
Redshift evolution of the dark-energy sector. Left: the dark-energy density ρDE(z)/ρDE0. Right: the equation of state wDE(z). The red solid line represents the best-fit MEDE model (CMB+DESI+PantheonPlus). The light-orange region shows the 2σ confidence region derived from MCMC chains, illustrating the posterior distribution of parameters. The green solid line shows the CPL parameterization ((CMB+DESI+PantheonPlus best-fit), and the black dashed line represents ΛCDM. The MEDE model exhibits a smooth transition around zt ∼ 0.42, crossing the phantom divide w = −1 from phantom-like (w < −1) at high redshifts to quintessence-like (w > −1) at low redshifts.
Other Images in This Article
Copyright and Terms & Conditions
© 2026. The Author(s). Published by the American Astronomical Society.