Image Details
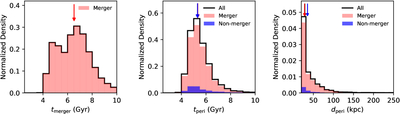
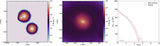
Caption: Figure 4.
Distribution of merger and pericenter outcomes in the fiducial four-body simulations. Left: normalized probability density of merger times (tmerge) for merger outcomes among all 10,000 realizations. Middle: normalized probability density of the first pericenter times (tperi) for both merging and nonmerging outcomes, with the black outline showing all cases. Right: same as the middle panel, but for the distribution of the first pericenter distances (dperi). In each panel, the colored arrows indicate the median values of the corresponding distributions. In the middle panel, the three median arrows nearly overlap due to similar first pericenter times across outcomes.
Other Images in This Article
Copyright and Terms & Conditions
© 2026. The Author(s). Published by the American Astronomical Society.