Image Details
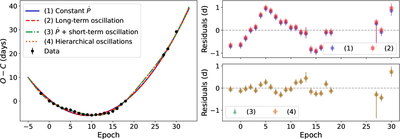
Caption: Figure 3.
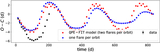
Left: O − C diagram of the QPEs overplotted with models 1–4. The data are consistent with P0 ≈ 9.5 days and ﹩\dot{P}\approx 1.7\times 1{0}^{-2}﹩ day day−1 at T0 ≈ 60710.1. In principle, it is possible that the apparent period increase is due to a long-term period oscillation observed locally (models 2 and 4); the > 1 yr data baseline over which ﹩\dot{P}﹩ is constant constrains any such oscillation to have a period ≳11 yr and amplitude ≳1000 days. Right: data−model residuals. Models 1–2 show structured residuals, which models 3–4 interpret as a sine with period ∼155 days and amplitude ∼0.8 days (though see Appendix).
Other Images in This Article
Copyright and Terms & Conditions
© 2026. The Author(s). Published by the American Astronomical Society.