Image Details
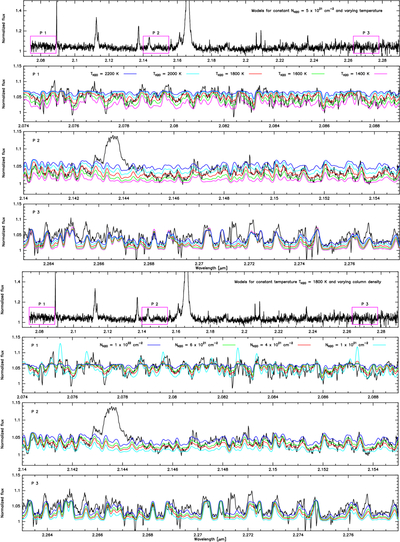
Caption: Figure 3.
Different fits for selected portions of LHA 115-S 18 K-band spectrum, showing the variation with the model parameters: temperature and column density. The best fit is for T(H2O) ≈ 1800 K and N(H2O) ≈ 4–6 × 1021 cm−2.
Other Images in This Article
Copyright and Terms & Conditions
© 2026. The Author(s). Published by the American Astronomical Society.
Copyright ©
2026 Astronomy Image Explorer. All Rights Reserved.