Image Details
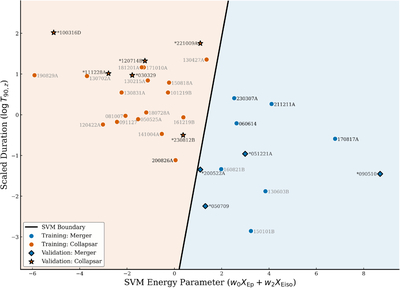
Caption: Figure 2.
The SVM classification plane. Distribution of training and independent validation GRBs projected onto the 2D plane derived from the standardized Ep,i–T90,z–Eiso parameter space. The solid black line indicates the optimal decision boundary established by the gold-standard training sample (C = 5). Training events are represented by circles (blue for mergers, orange for collapsars). Independent validation events (Table 2) are shown with enlarged markers and thick black edges: blue diamonds for mergers and orange stars for collapsars (asterisks denote validation GRBs). All validation cases are correctly classified into their respective physical regions, confirming the robustness and generalizability of the SVM model.
Other Images in This Article
Copyright and Terms & Conditions
© 2026. The Author(s). Published by the American Astronomical Society.