Image Details
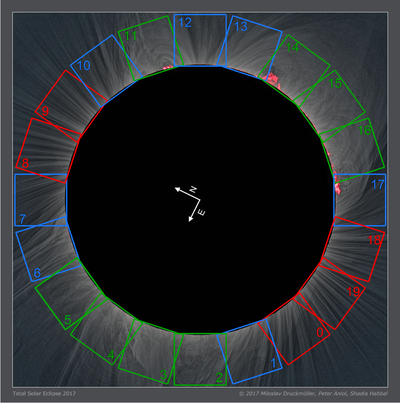
Caption: Figure 1.
Highest-resolution WL image of the solar corona taken during the TSE of 2017 August 21, from Oregon, USA, which shows some chromospheric emission and several prominences. There are 20 selected 400 × 400 pixel2 subregions marked for the turbulence analysis. In this work, green boxes denote closed-field, loop-like equatorial regions; red boxes mark open-field, ray-like regions; and blue boxes mark regions where there is a mix of both along the line of sight. Each subregion spans a radially projected physical size of ∼0.4 R⊙ and samples coronal structure within this heliocentric distance.
Other Images in This Article
Copyright and Terms & Conditions
© 2026. The Author(s). Published by the American Astronomical Society.
Copyright ©
2026 Astronomy Image Explorer. All Rights Reserved.