Image Details
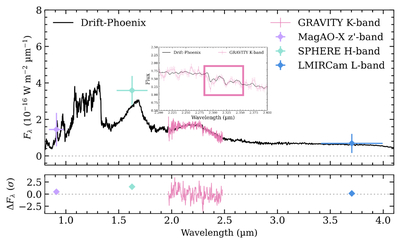
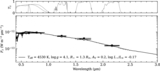
Caption: Figure 3.
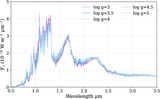
Drift-Phoenix spectral model overlaid with the K-band spectrum obtained with VLTI/GRAVITY, H-band VLT/SPHERE, ﹩z^{\prime} ﹩-band MagAO-X, and L-band LBTI/LMIRCam photometry of WISPIT 2 c. The modeled spectrum is based on the max likelihood fitting of temperature and radius. The figure also contains a zoomed-in region of 2.2–2.4 μm to highlight the CO absorption band heads, marked by the pink box.
Other Images in This Article
Show More
Copyright and Terms & Conditions
© 2026. The Author(s). Published by the American Astronomical Society.
Copyright ©
2026 Astronomy Image Explorer. All Rights Reserved.