Image Details
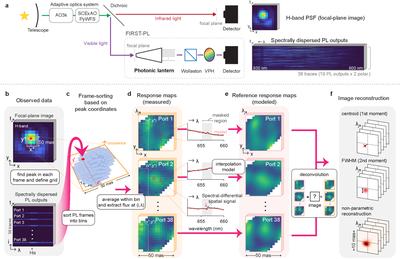
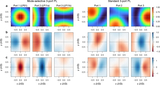
Caption: Figure 2.
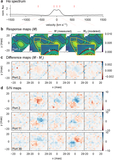
The observation setup and data processing procedure. (a) A simplified diagram of the observation setup. After two-stage AO correction of the light collected by the Subaru Telescope, the visible light is directed to the FIRST-PL module recording spectrally dispersed outputs of the 19-port PL, and the infrared light is sent to a high-speed detector at the focal plane with an H-band filter in. (b) Example H-band PSF and corresponding PL spectrum. The PSF peak location (x*, y*) is measured from each H-band focal-plane frame and is associated with the corresponding PL spectrum frame. (c) Frame-sorting procedure. The PL spectrum data are binned by the PSF peak locations, with a resolution of 15 × 15 spanning 48.6 mas. (d) Reconstructed PL response maps. Each port’s response map exhibits a unique response, with gradual variation across wavelengths. The model responses are constructed by masking the Hα wavelength range (where spatial signals are expected) and fitting the measured response maps with polynomial functions, then interpolating the coefficients in the masked wavelength range. Spectral-differential spatial signals are identified as deviations of the response maps from the model. (e) Model reference response maps, which correspond to the response maps of a point-like source. (f) Image reconstruction is achieved by solving for the intensity distribution that, when convolved with the reference response maps, best describes the measured response maps. The first and second moments can be estimated by modeling the image as a point source and a 2D Gaussian, respectively. Without any simplifying models, nonparametric image reconstruction can be achieved.
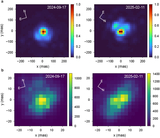
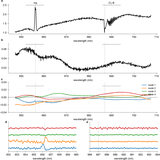
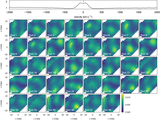
Other Images in This Article

Copyright and Terms & Conditions
© 2025. The Author(s). Published by the American Astronomical Society.