Image Details
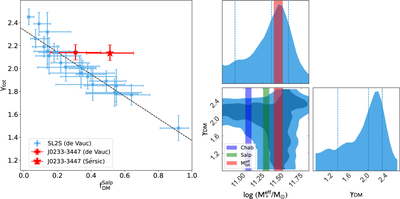
Caption: Figure 4.
Left: the relationship between total mass density slope γtot and DM fraction (Salpeter IMF, ﹩{f}_{\mathrm{DM}}^{\mathrm{Salp}}﹩) for the SL2S sample (squares) and of KiDS J0233−3447 by assuming a de Vaucouleurs (circle) and Sérsic (star) foreground light profile. The black dashed line shows the line fit of the SL2S sample. Right: the MCMC inference for DM slope γDM and the stellar mass inside the Reff. The stellar masses inferred from the Chabrier and Salpeter IMFs (also inside the Reff) are shown with blue and green bars, respectively.
Other Images in This Article
Copyright and Terms & Conditions
© 2025. The Author(s). Published by the American Astronomical Society.
Copyright ©
2026 Astronomy Image Explorer. All Rights Reserved.