Image Details
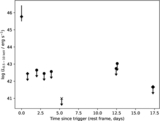
Caption: Figure 13.
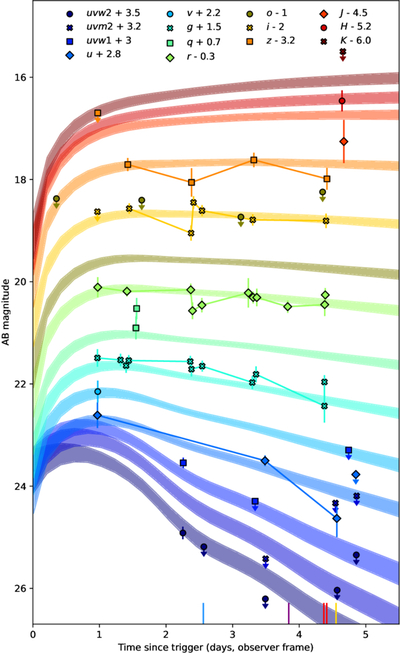
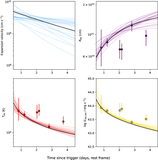
The UVOIR light curve of SN 2025kg’s fast cooling phase fitted with a shocked cocoon model. The shaded regions indicate the 68% credible interval of the posterior predictive distribution for each band. The vertical lines indicate the times of our spectroscopic observations (with colors corresponding to Figure 4).
Other Images in This Article

Show More
Copyright and Terms & Conditions
© 2025. The Author(s). Published by the American Astronomical Society.
Copyright ©
2025 Astronomy Image Explorer. All Rights Reserved.