Image Details
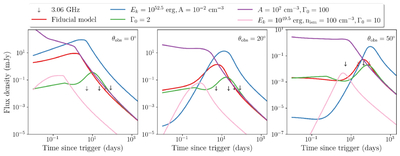
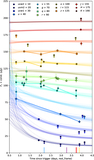
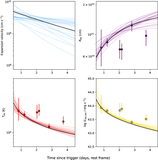
Caption: Figure 12.
Radio afterglows at 3.06 GHz following a “top-hat” jet for different assumptions of the fiducial model indicated by the red curves. The three panels correspond to different observer viewing angles while the arrows indicate upper limits from our radio observations.
Other Images in This Article

Show More
Copyright and Terms & Conditions
© 2025. The Author(s). Published by the American Astronomical Society.
Copyright ©
2025 Astronomy Image Explorer. All Rights Reserved.