Image Details
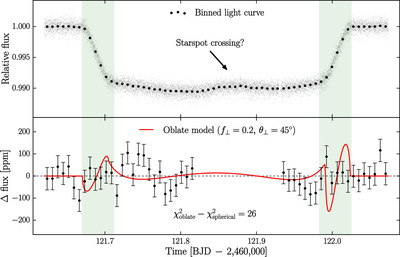
Caption: Figure 2.
JWST NIRSpec light curve of Kepler-51d (top) and the deviations between the data and the best-fit spherical-planet model (bottom). To illustrate the effects of oblateness on the light curve, the red curve shows the deviations between the best-fit oblate-planet model with arbitrary, fixed oblateness parameters (f⊥ = 0.2 and θ⊥ = 45∘) and the best-fit spherical-planet model. The deviations are largest during ingress and egress (highlighted in green) and are incompatible with the data (Δχ2 = 26). Note that the data spanning the bump in the light curve (probably due to a starspot-crossing event) were omitted before fitting.
Other Images in This Article
Copyright and Terms & Conditions
© 2024. The Author(s). Published by the American Astronomical Society.