Image Details
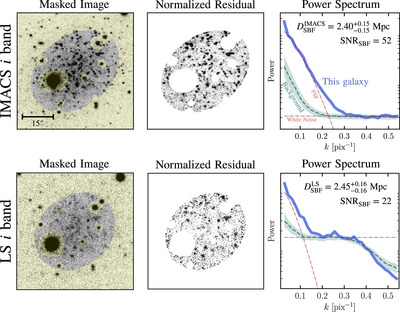
Caption: Figure 2.
The SBF measurements for Hedgehog using the IMACS i-band data (top panels) and the Legacy Surveys DR10 i-band data (bottom panels). The left panels show the original image with the mask overlaid in yellow. We fit a Sérsic model to the masked image, subtract the model from the image, and divide the residual by the square root of the model. This normalized residual image is shown in the middle panels. We then calculate the azimuthally averaged power spectrum of the normalized residual, as shown in the right panels. The power spectrum is fit with a combination of the PSF power spectrum and white noise. To account for the contribution from unmasked sources, we measure SBF signals on randomly selected blank fields, whose power spectra are shown as the teal dashed line. After subtracting the background contribution, we calculate the median SBF signal and its standard deviation and convert it to distance using the SBF–color relation in Carlsten et al. (2019). The SBF distances from IMACS and Legacy Surveys DR10 are ﹩{D}_{\mathrm{SBF}}^{\mathrm{IMACS}}=2.40\pm 0.15\ \mathrm{Mpc}﹩, ﹩{D}_{\mathrm{SBF}}^{\mathrm{LS}}=2.45\pm 0.16\ \mathrm{Mpc}﹩. These two independently measured distances are fully consistent.
Other Images in This Article

Copyright and Terms & Conditions
© 2024. The Author(s). Published by the American Astronomical Society.