Image Details
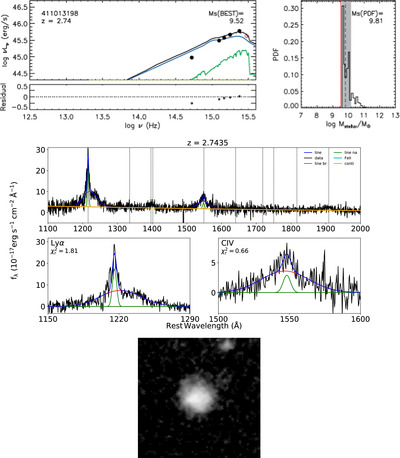
Caption: Figure B1.
One of the 12 “cosmic noon” low-mass galaxies hosting an overmassive BH. Top left: spectral energy distribution fitting of the rest-frame observed ultraviolet, optical, and infrared (when available) photometry (black points) with the best-fit model (black curve), including a combination of the galaxy template (green), an AGN accretion disk component (blue), and an AGN dust torus model (yellow). Top right: PDF for the stellar mass taking into account all possible fractions of AGN emission and providing an upper limit on the stellar mass. So the most probable value (MsPDF blue dashed line) has a higher value than the best-fit stellar mass (MsBEST, red solid line). The 16 and 84 percentile intervals (gray shades) are also indicated. Middle: emission line fitting of the VIPERS spectrum including the continuum emission (in yellow, top panel), and the broad lines (in blue) decomposed into broad (in red) and narrow (in green) components (zoom-in in the bottom panels). Bottom: Subaru Hyper Suprime-Cam image in the i band.
Other Images in This Article
Copyright and Terms & Conditions
© 2024. The Author(s). Published by the American Astronomical Society.