Image Details
Caption: Figure 4.
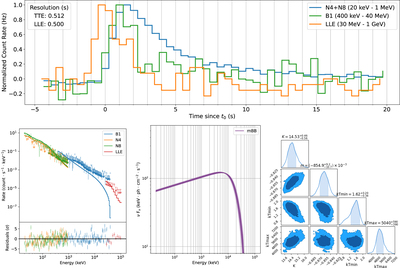
Top: background-subtracted and normalized light curves of 0.512 s binned Fermi-GBM TTE data and 1.0 s binned LLE data for the triggering pulse with the higher-energy photons arriving prior to the lower-energy photons. Bottom: the fitted counts spectrum (left), the model spectrum (center), and the posteriors of the model parameters (right) for the mBB function fitted to the triggering pulse.
Other Images in This Article


Copyright and Terms & Conditions
© 2023. The Author(s). Published by the American Astronomical Society.
Copyright ©
2026 Astronomy Image Explorer. All Rights Reserved.