Image Details
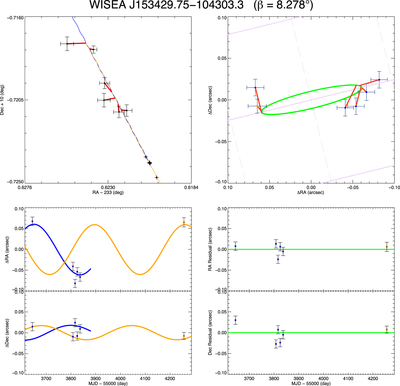
Caption: Figure 2.
Astrometric fit for WISE 1534−1043. (Upper left) A square patch of sky showing the measured positions and uncertainties at each epoch (black points with error bars). The blue curve shows the best fit from the vantage point of Spitzer, and the orange curve shows the best fit from the vantage point of the Earth. Red lines connect each observation to its time on the corresponding best-fit curve. (Upper right) A square patch of sky centered at the mean equatorial position of the target. The green curve is the parallactic fit, and the only observational data points plotted are those with the smallest uncertainties from the previous panel, i.e., those from Spitzer (filled blue squares) and HST (filled orange circle). Again, red lines connect the time of observation with its prediction. Pale purple solid and dashed lines mark lines of constant β and λ, respectively, at 0.″1 spacing. (Lower left) R.A. and decl. as a function of time for the Spitzer and HST points. The best-fit parallax curve as seen from the vantage points of Spitzer and HST is shown in blue and orange, respectively. The blue curve ends in 2020 January, the end of the Spitzer mission. (Lower right) The R.A. and decl. residuals from the parallax fit as a function of time. Color coding is the same as in previous panels.
Other Images in This Article


Copyright and Terms & Conditions
© 2021. The American Astronomical Society. All rights reserved.