Image Details
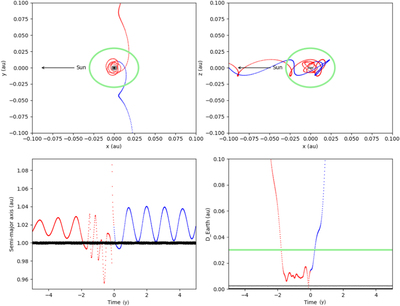
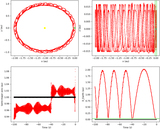
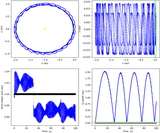
Caption: Figure 6.
Top left panel: mean geocentric corotating Cartesian y and x coordinates of 2020 CD3 orbital clones ±5 yr centered on 2020 March 23 UTC encompassing its ∼700 day capture completing ∼five revolutions around the Earth–Moon system. The red dotted line indicates the trajectory of 2020 CD3 before 2020 March 23 UTC, and the blue dotted line indicates the trajectory of 2020 CD3 after 2020 March 23 UTC. A green circle with a radius of three times the Earth’s Hill radii of ∼0.03 au is overplotted. The direction toward the Sun in the corotating frame is indicated. Top right panel: same as the top left panel except for mean geocentric corotating Cartesian x and z coordinates. Bottom left panel: evolution of 2020 CD3’s orbital clones’ mean semimajor axes ±5 yr centered on 2020 March 23 UTC. The color code of the dotted lines is the same as in the top panels. Bottom right panel: mean geocentric distance of 2020 CD3 orbital clones ±5 yr centered on 2020 March 23 UTC. A horizontal green line indicates three times the Hill radii in distance. The color code of the dotted lines is the same as in the previous three panels.
Other Images in This Article
Copyright and Terms & Conditions
© 2020. The American Astronomical Society. All rights reserved.