Image Details
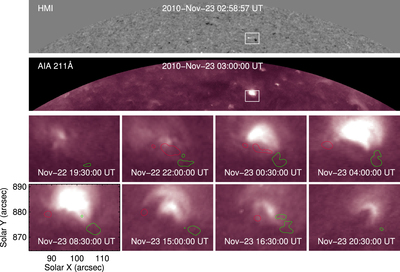
Caption: Figure 4.
Another example of an identified BME. Similar to Figure 3, the top two panels display the BME on the images from the HMI and AIA at 211 Å waveband. The bottom eight panels show the variation of EUV intensity at the 211 Å waveband during the BME evolution, and the red and the green lines mean the contours of 30 G for the positive and negative magnetic field, respectively.
Other Images in This Article
Copyright and Terms & Conditions
© 2020. The Author(s). Published by IOP Publishing Ltd on behalf of the American Astronomical Society.
Copyright ©
2026 Astronomy Image Explorer. All Rights Reserved.