Image Details
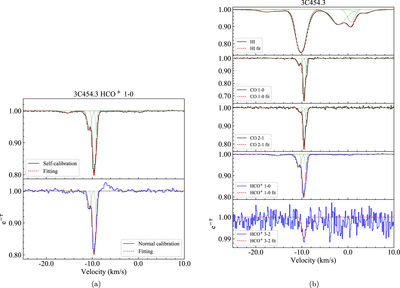
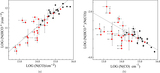
Caption: Figure 1.
(a) Comparison of absorption spectra obtained through self- (black curve) and normal (blue curve) calibration. (b) Spectra of ﹩{\rm{H}}\,{\rm{I}}﹩, CO, and HCO+ (solid line) toward 3C454.3. The red dashed lines show the Gaussian fit profiles for each line, and the green dotted lines show each of the Gaussian components. The x-axis and y-axis denote the velocity range in ﹩\mathrm{km}\,{{\rm{s}}}^{-1}\,﹩ and the normalized line intensity, respectively.
Other Images in This Article
Copyright and Terms & Conditions
© 2020. The American Astronomical Society. All rights reserved.
Copyright ©
2026 Astronomy Image Explorer. All Rights Reserved.