Image Details
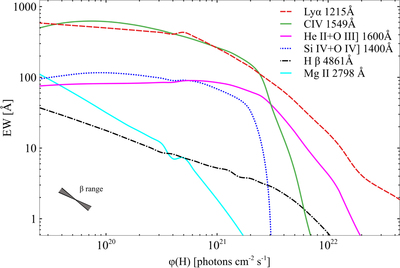
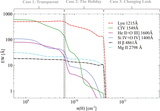
Caption: Figure 2.
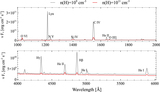
EW of emission lines vs. the flux of hydrogen-ionizing photons. The EWs are normalized to the continuum at 1367 Å. For most of the lines, the predicted EWs decrease when ϕ(H) > 1020, the observed behavior. The bow tie shows the range of β observed for various lines before the holiday.
Other Images in This Article
Copyright and Terms & Conditions
© 2019. The American Astronomical Society. All rights reserved.
Copyright ©
2026 Astronomy Image Explorer. All Rights Reserved.