Image Details

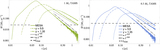
Caption: Figure 1.
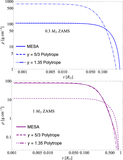
Stellar density profiles computed with MESA in g cm−3 as a function of radius in Solar radii. The left panel shows the 0.3 M⊙ star, the middle the 1 M⊙ star, and the right the 3 M⊙ star, with the different ages shown by the different lines as indicated in the legends.
Other Images in This Article
Copyright and Terms & Conditions
© 2019. The American Astronomical Society. All rights reserved.
Copyright ©
2026 Astronomy Image Explorer. All Rights Reserved.