Image Details
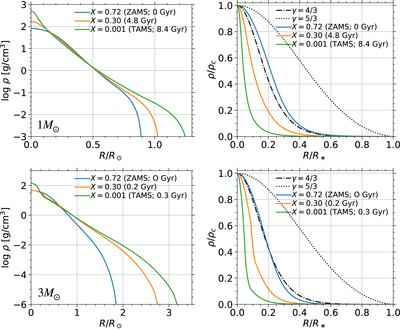
Caption: Figure 1.
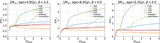
MESA density profiles for a 1M⊙ star (top panels) and 3M⊙ star (bottom panels) along their MS lifetimes. X is the central hydrogen mass fraction. Left panels: density vs. radius. Right panels: normalized to central density and stellar radius. Dashed and dotted lines show profiles for γ = 4/3 and γ = 5/3 polytropes, respectively.
Other Images in This Article
Copyright and Terms & Conditions
© 2019. The American Astronomical Society. All rights reserved.
Copyright ©
2026 Astronomy Image Explorer. All Rights Reserved.