Image Details
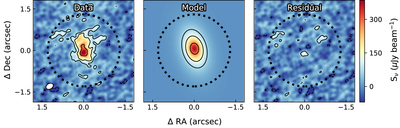
Caption: Figure 5.
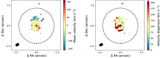
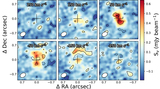
The left panel is the moment zero of the data (as in the right panel of Figure 2). The middle panel is the best-fit model of a simple smooth disk to the data (see Section 3.5). The right panel is the data minus the model; the solid (dashed) contours represent the +(−)2σ residuals. The black dotted circles mark the region used to measure the total flux densities (see Figure 2).
Other Images in This Article
Copyright and Terms & Conditions
© 2019. The American Astronomical Society. All rights reserved.
Copyright ©
2026 Astronomy Image Explorer. All Rights Reserved.