Image Details
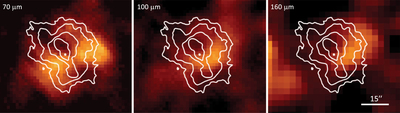
Caption: Figure 2.
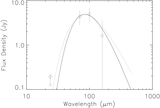
Herschel PACS images of the PWN region in Kes 75 at 70, 100, and 160 μm. The white contours represent the Chandra X-ray emission from the PWN. The corresponding measured flux densities are listed in Table 1.
Other Images in This Article
Copyright and Terms & Conditions
© 2019. The American Astronomical Society. All rights reserved.
Copyright ©
2026 Astronomy Image Explorer. All Rights Reserved.