Image Details
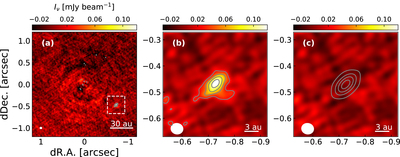
Caption: Figure 3.
233 GHz images after the extraction of the emission feature. (a) CLEANed image of the residual emission reconstructed from the visibilities obtained by subtracting the axisymmetric emission in the u–v plane. (b) Close-up view of the 0.″4 × 0.″4 box of the residual image (white box in the main panel (a)). The gray contour starts at ±3σ with an interval of 3σ. (c) Result of the 2D Gaussian fitting to the emission feature (contour) and the difference between the fitted Gaussian and the extracted emission feature (color). The gray contour starts at ±3σ with an interval of 3σ.
Other Images in This Article
Copyright and Terms & Conditions
© 2019. The American Astronomical Society. All rights reserved.
Copyright ©
2026 Astronomy Image Explorer. All Rights Reserved.