Image Details
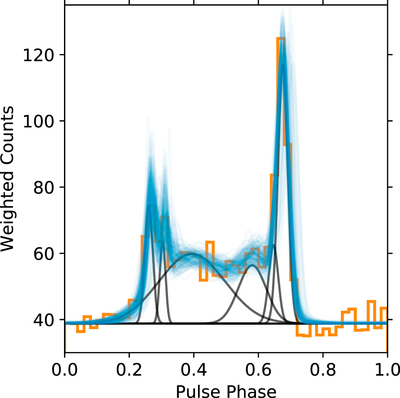
Caption: Figure 1.
Histogram (orange) of the photon weights using pulse phase from the best-fit timing model (see the main text). Shown as solid black lines are the six wrapped Gaussian components of the analytic profile. The faint blue lines show 200 randomly chosen realizations of the template from the Monte Carlo Markov chain (MCMC) fits with the template parameters allowed to vary.
Other Images in This Article
Copyright and Terms & Conditions
© 2019. The American Astronomical Society. All rights reserved.
Copyright ©
2026 Astronomy Image Explorer. All Rights Reserved.