Image Details
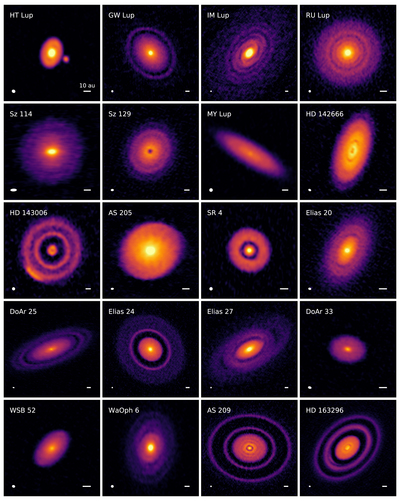
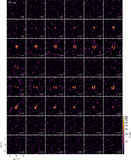
Caption: Figure 3.
Gallery of 240 GHz (1.25 mm) continuum emission images for the disks in the DSHARP sample. Beam sizes and 10 au scalebars are shown in the lower left and right corners of each panel, respectively. All images are shown with an asinh stretch to reduce the dynamic range (accentuate fainter details without over-saturating the bright emission peaks). For more quantitative details regarding the image dimensions and intensity scales, see Huang et al. (2018a) and Kurtovic et al. (2018).
Other Images in This Article
Copyright and Terms & Conditions
© 2018. The American Astronomical Society. All rights reserved.
Copyright ©
2026 Astronomy Image Explorer. All Rights Reserved.