Image Details
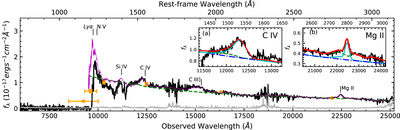
Caption: Figure 1.
Final calibrated spectrum of J0038–1527. The black and gray lines represent the Galactic extinction corrected spectrum and error vector. The thin magenta line denotes the quasar composite spectrum constructed with ∼200 Sloan Digital Sky Survey (SDSS) quasars with large C IV blueshifts. The green dashed line denotes the pseudo-continuum, which includes power-law, Fe II emission, and Balmer continuum. The orange circles are flux-density converted from galactic extinction corrected magnitudes listed in Table 1. The x-axis error bars of the two leftmost orange circles denote the FWHMs of zDELS and yps1 filter curves. Two inner plots show spectral fitting of C IV (a) and Mg II (b) regions, respectively. The blue dotted–dashed line denotes the best-fit power-law continuum, the green dashed line denotes the best-fit pseudo-continuum. The cyan line denotes fitted C IV and Mg II emission lines plus power-law continuum, and the red line denotes the total fitted flux.
Other Images in This Article
Copyright and Terms & Conditions
© 2018. The American Astronomical Society. All rights reserved.