Image Details
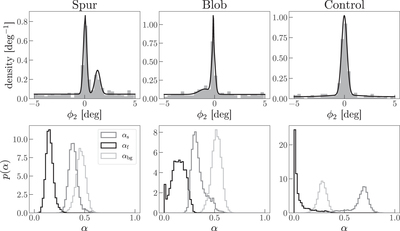
Caption: Figure 5.
Top row: density of stars in ϕ2 (gray) and inferred density (black curve) for regions around the spur, blob, and a control field. The model for the density includes components for the stream, background, and a feature overdensity (the spur or the blob), but with amplitudes that are allowed to go to zero (see Section 3.2 for more details.) Bottom row: inferred posterior probability distributions over the amplitude (α) of each component in each field: αs for the stream, αbg for the background, and αf for the feature. In both feature fields, the model prefers an additional component to describe the feature, whereas in the control field the density is consistent with stream + background.
Other Images in This Article


Copyright and Terms & Conditions
© 2018. The American Astronomical Society. All rights reserved.