Image Details
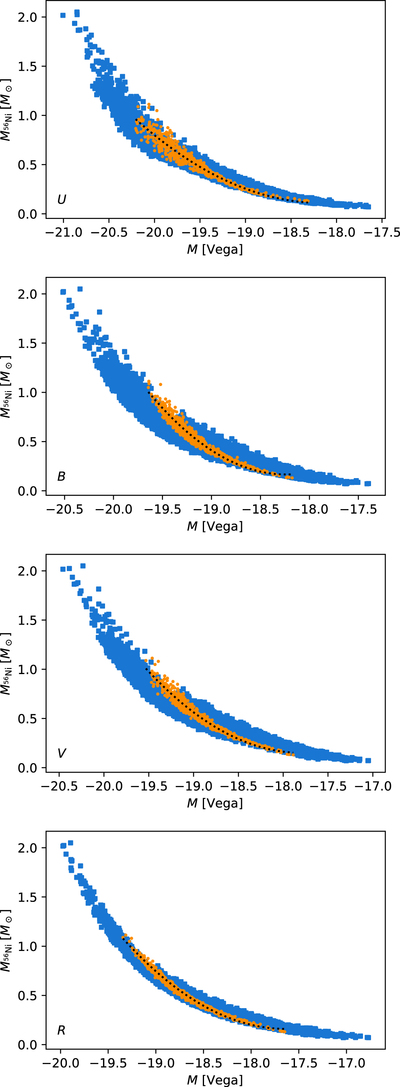
Caption: Figure 4.
Correlation between ﹩{M}_{{}^{56}\mathrm{Ni}}﹩ and peak brightness for models off the WLR (blue squares) and on the WLR (orange dots). The quadratic fitting functions in Equations (8)–(11) are plotted as black dashed lines in each panel.
Other Images in This Article
Copyright and Terms & Conditions
© 2018. The American Astronomical Society. All rights reserved.
Copyright ©
2026 Astronomy Image Explorer. All Rights Reserved.